Get the full picture
Key Metrics Evaluation

Engagement
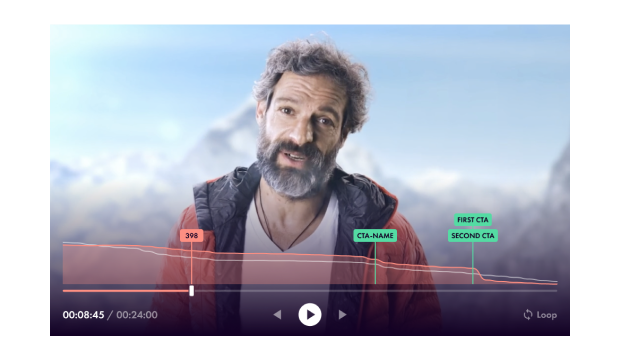
Audience retention can be measured to precisely evaluate how many viewers watched the video and how they watched it. These metrics use values like total playback time, number of playbacks or playback time per video. Based on this, the graph of the video timeline and how many users were watching at each second can be displayed. The appearance of CTAs to viewers is also shown on the graph.
Possible use cases:
- how many users watched till ‘X‘seconds?
- how many times were videos reopened on average?
- how many minutes were watched in total?
- how many users were watching when the CTA button appeared in video?
Views, unique views and opened videos
The number of opened videos and views of every video is measured. You can also determine the number of unique visitors and repeated playbacks on a daily basis. These values are displayed in aggregation and graph per day with filtering capabilities.
Possible use cases:
- how many views do we have?
- how many unique playbacks do we have on daily basis?
- how many views and unique views did we have on a specific date?
- how many videos were opened?
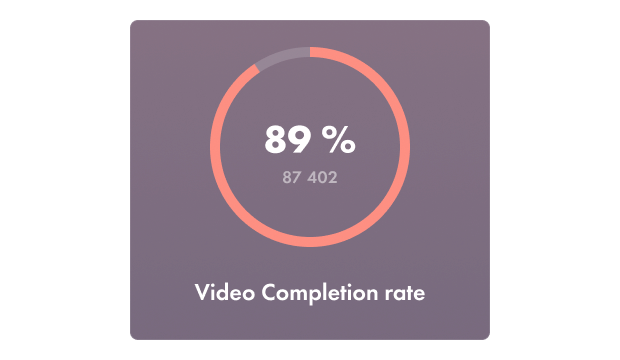
Open, bounce and completion rate
These viewing metrics can also be measured:
- Open rate (ratio of opened videos against total videos)
- Bounce rate (ratio of videos which were opened but not played)
- Completion rate (ratio of fully watched videos against partially watched videos)
Possible use cases:
- how many videos were opened?
- how many videos were opened but not played?
- how many videos were played to the end?
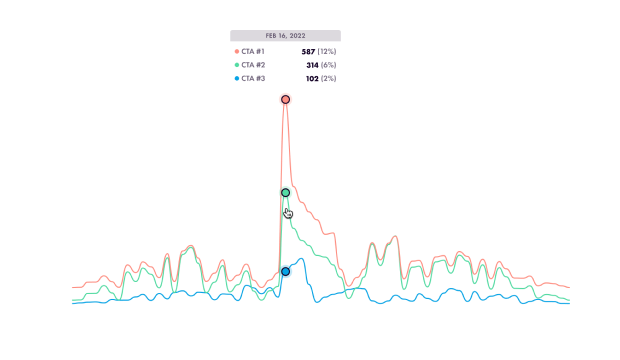
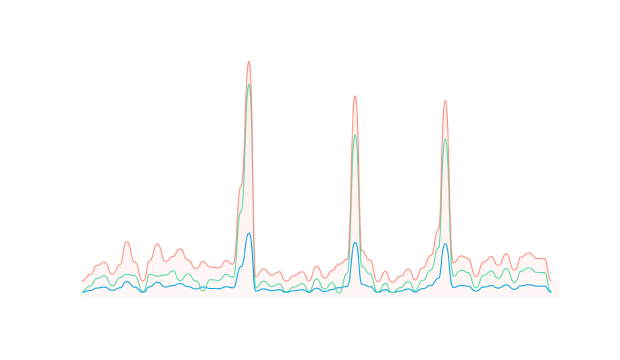
Call to Action button, actions and views
Conversions are measured by actions provided by Call To Action buttons (CTAs). This metric displays Total clicks on CTAs, how many CTAs were presented in the video and the CTA Click ratio (% of viewers who clicked on the CTA button).
Possible use cases:
- what is the actual conversion rate of the video?
- in combination with the engagement graph, was the appearance of the CTA button set at the correct time?
Role of the analytics manager
Analytics managers can only view the anonymized results of a campaign and don’t have access to any sensitive data of the target audience. Your organization has the ability to grant access to view the results of a campaign to specific users on a role-based system.
Filtering by target audience
In the manual mode of data import, there is the possibility to split audiences based on the imported files and then evaluate the results. Any of the metrics described above can be filtered based on the target audience. This is useful for A/B testing, distinquishing different distribution channels, etc.
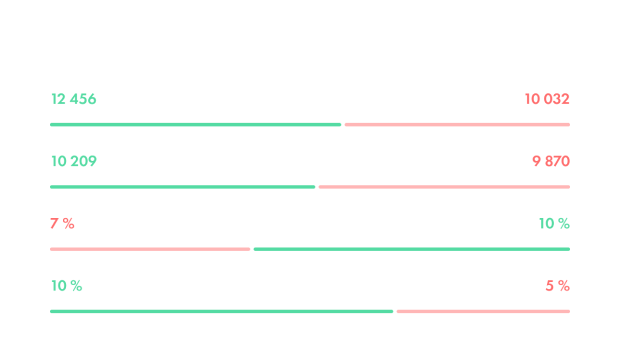
The metrics that matter
See the Benefits of Personalization
APersonalized Video
BEmailing
A/B Testing has shown that personalized campaigns perform much better than non-personalized campaigns in metrics such as views, open rate, VTR and CTA click rate. Find out more about how your key metrics can be evaluated in our blog here.
